Not all customers are equal, and treating them as if they are is how marketing budgets get wasted. The person who bought from you yesterday for the fifth time should not get the same message as the one who bought once, eighteen months ago, and never came back. RFM analysis is the oldest, simplest, and still one of the most effective ways to tell them apart.
RFM stands for Recency, Frequency, and Monetary value. It scores every customer on three behaviors that, taken together, predict who is about to buy again, who is drifting away, and who deserves your VIP treatment. The best part is that it needs almost no fancy tooling. If you have a transaction history, you can build it.
This guide explains the three dimensions, how to score customers, and how to turn the scores into segments you can actually market to. It is a hands-on companion to the strategy in audience segmentation.
The Three Dimensions of RFM
RFM works because these three signals capture most of what predicts future buying behavior, using only data you already have.
- Recency: how long ago a customer last bought. Recent buyers are dramatically more likely to buy again. Of the three, recency is usually the strongest single predictor of the next purchase.
- Frequency: how many times a customer has bought. Frequent buyers have a proven habit. They are your most reliable, lowest-cost revenue.
- Monetary value: how much a customer has spent in total. High spenders are worth protecting and worth a deeper investment in retention.
Each dimension answers a different question. Recency asks “is this customer still engaged?” Frequency asks “is buying from us a habit?” Monetary asks “how much are they worth?” You need all three because any one alone misleads. A customer who spent a fortune two years ago and vanished looks great on monetary value and terrible on recency. The combination tells the truth.
How to Score Customers
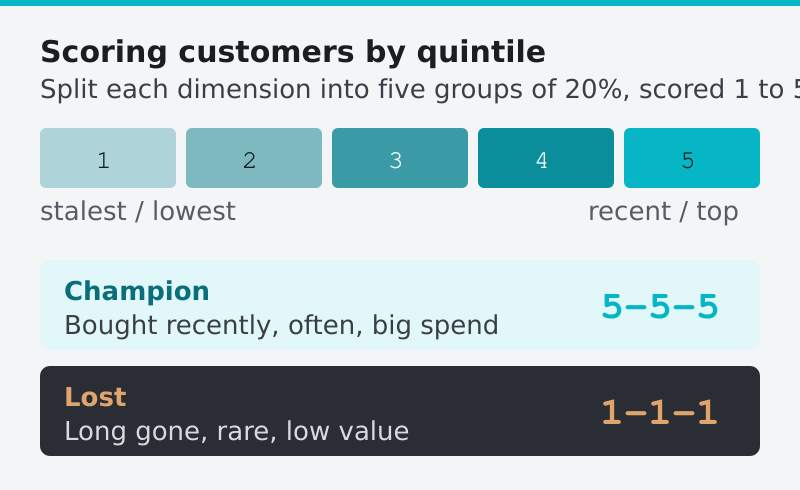
The classic method is to split your customers into five groups on each dimension, scoring from 1 to 5. The simplest, most defensible way to do this is by quintiles, where each score represents 20% of your customer base.
For recency, the most recent 20% of buyers score 5, the next 20% score 4, and so on down to the stalest 20% scoring 1. For frequency and monetary value, the highest 20% score 5. The result is that every customer gets a three-digit code like 5-5-5 (your best) or 1-1-1 (long gone, low value).
Here is what the scoring logic looks like in practice.
| Score | Recency | Frequency | Monetary |
|---|---|---|---|
| 5 | Bought very recently | Buys most often | Highest total spend |
| 4 | Bought recently | Buys often | High spend |
| 3 | Mid | Average | Average |
| 2 | A while ago | Infrequent | Low spend |
| 1 | Long ago | Rarely | Lowest spend |
Quintiles are the standard, but they are not sacred. If you sell something people buy once a year, frequency scores will bunch up and lose meaning, so you might drop to a two- or three-band scale. Match the granularity to your data, not to a textbook.
Turning Scores Into Segments
A three-digit code is precise but unwieldy. There are 125 possible combinations, and nobody runs 125 campaigns. The practical move is to group the codes into a handful of named segments you can build messaging around.
These are the segments I reach for first, and what each one needs from you.
| Segment | RFM pattern | What they need |
|---|---|---|
| Champions | High R, high F, high M | Reward and VIP treatment; ask for referrals and reviews |
| Loyal customers | High F, moderate R | Upsell, loyalty perks, early access |
| Big spenders | High M, moderate F | Personal attention; protect this revenue |
| At risk | Low R, formerly high F or M | Win-back campaign before they fully lapse |
| New customers | High R, low F | Onboarding and a strong second-purchase nudge |
| Lost | Low R, low F, low M | Minimal effort; occasional reactivation only |
The “at risk” segment is the one I tell every team to act on first. These are customers who used to buy often or spend a lot but have gone quiet. They already know and trust you, which makes them far cheaper to re-engage than a cold prospect. A timely win-back offer to this group routinely returns more per dollar than any acquisition campaign.
How to Build RFM in Practice
You can run a first RFM pass in a spreadsheet, and honestly that is where I tell people to start. The steps are mechanical.
- Pull a transaction export with one row per order: customer ID, order date, and order value.
- Calculate the three raw numbers per customer: days since last order (recency), total order count (frequency), and total spend (monetary).
- Rank each metric into quintiles and assign the 1–5 scores. Spreadsheet percentile functions handle this in one column each.
- Concatenate the three scores into a single code, then map codes to your named segments with a lookup.
- Export the segment list and feed it into your email or ad platform as audiences.
Once the logic works in a spreadsheet, you can graduate to a scheduled query or a tool that refreshes the scores automatically. But do not over-engineer the first version. The value is in acting on the segments, and a manual monthly refresh delivers most of that value while you are still learning what works.
Where RFM Shines and Where It Falls Short
RFM earns its long life because it is cheap, interpretable, and surprisingly accurate at predicting near-term behavior. A marketing manager can understand a Champions segment instantly, which means RFM-based campaigns actually get launched rather than dying in a model nobody trusts.
But it has real limits, and pretending otherwise leads to bad decisions.
- It is backward-looking. RFM scores past behavior. It assumes the future resembles the past, which is usually but not always true.
- It ignores everything but transactions. Product interest, support history, and engagement signals are invisible to RFM. A customer can be browsing daily and still score low on recency if they have not purchased.
- It does not handle one-time-purchase businesses well. If people buy from you once and rarely again, frequency carries no signal.
The right way to think about RFM is as a fast, reliable first cut, not the final word. It pairs naturally with the richer behavioral and value-based approaches you will find in our collection of customer segmentation examples, where transaction scores become one input among several.
A Sensible Cadence
RFM scores are not static. A customer who is a Champion today can slide toward “at risk” if they stop buying, and the whole point is to catch that movement early. Refresh your scores on a regular schedule, monthly works for most businesses, and watch customers migrate between segments.
That migration is the most useful signal RFM produces. A Champion drifting toward at-risk is an early warning you can act on before they are gone. It also raises the question RFM alone cannot answer, why high-RFM customers still churn, which is where a proper churn analysis takes over. A new customer climbing toward loyal is a sign your onboarding is working. Run RFM as a living report, not a one-time analysis, and it becomes a steady radar for the health of your customer base.
FAQ
What does RFM stand for?
RFM stands for Recency, Frequency, and Monetary value. It is a segmentation method that scores each customer on how recently they bought, how often they buy, and how much they have spent, then combines those scores to predict future behavior and group customers for targeted marketing.
Which RFM dimension matters most?
Recency is usually the strongest single predictor of whether a customer will buy again soon. Someone who purchased recently is far more likely to purchase again than someone who has not bought in a long time, regardless of how much they spent in the past. That said, the real power comes from combining all three dimensions.
Can I do RFM analysis in a spreadsheet?
Yes, and it is a great place to start. Export your transactions, calculate days since last order, total order count, and total spend per customer, then rank each into quintiles and combine the scores. Percentile functions handle the scoring in a few columns. You can automate later, but a manual monthly refresh delivers most of the value.
What is the most valuable RFM segment to act on?
The “at risk” segment usually offers the best return. These are customers who previously bought often or spent a lot but have gone quiet. Because they already trust you, a timely win-back campaign re-engages them far more cheaply than acquiring new customers, and it prevents valuable relationships from lapsing entirely.