Here is a number that quietly runs most growth decisions: how much a customer is worth over their entire relationship with you. It decides how much you can spend to acquire one, which segments deserve your best support, and whether a “successful” marketing channel is actually losing you money. That number is customer lifetime value, and the single biggest mistake teams make is calculating one blended figure for everyone.
A blended lifetime value is an average of wildly different customers. Your best segment might be worth ten times your worst, and the average hides both. Calculate lifetime value by segment and you stop making one-size-fits-all bets with money that should be going to your most profitable customers.
This guide covers how to calculate lifetime value, how to break it down by segment, and how to act on the gaps you find. It builds directly on the practical work of defining customer segmentation examples, so if your segments are not defined yet, sort that first.
What Customer Lifetime Value Really Measures
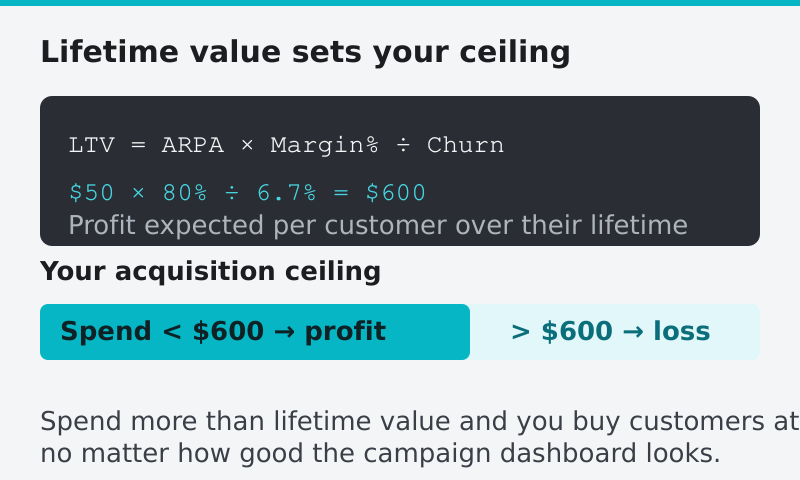
Customer lifetime value is the total profit you expect from a customer across the entire time they stay with you. Note the word profit, not revenue. A customer who pays you a lot but costs a fortune to support is worth less than the topline suggests.
The reason it matters so much is that it sets your acquisition ceiling. If a customer is worth $600 in profit over their lifetime, you can afford to spend a meaningful fraction of that to acquire one and still come out ahead. Spend more than the lifetime value and you are buying customers at a loss, no matter how good the campaign dashboard looks.
That relationship between lifetime value and acquisition cost is the foundation of sustainable growth. Most of the businesses I have watched stall did not have a traffic problem. They had a unit-economics problem they could not see because they never split lifetime value by segment.
The Simple Lifetime Value Formula
You can get surprisingly far with basic arithmetic. The standard formula for a subscription business is:
Lifetime Value = Average Revenue per Account × Gross Margin % ÷ Churn Rate
Let me unpack each piece, because each one is also a lever you can pull.
- Average revenue per account is what a typical customer pays you per period, usually per month.
- Gross margin turns revenue into profit. If serving a customer costs you 20% of what they pay, your margin is 80%. Skipping this step is how teams overstate lifetime value.
- Churn rate is the percentage of customers who leave each period. Its inverse (1 divided by churn) is the average customer lifespan. A 5% monthly churn means an average lifespan of 20 months.
So a customer paying $50 a month, at 80% margin, with 5% monthly churn, is worth $50 × 0.80 ÷ 0.05 = $800. Change any input and the answer moves. Cut churn from 5% to 4% and lifetime value jumps to $1,000 without raising prices at all. That sensitivity is exactly why churn reduction is usually the highest-leverage growth move available, and why it pays to know where your churn is coming from before you spend on retention.
Why You Must Break It Down by Segment
The formula above gives you one number. The trouble is that “average customer” is a fiction. Your customer base is a blend of segments with radically different economics.
Consider a SaaS product with three plan tiers. A blended lifetime value of $800 might hide this reality:
| Segment | Monthly revenue | Monthly churn | Lifetime value (80% margin) |
|---|---|---|---|
| Starter | $15 | 9% | $133 |
| Growth | $60 | 4% | $1,200 |
| Enterprise | $300 | 1.5% | $16,000 |
Look at the spread. An Enterprise customer is worth more than 100 Starter customers. If your marketing optimizes for raw signup count, you are pouring budget into the least valuable segment while underinvesting in the one that funds the business. The blended $800 told you none of this.
This is the entire argument for segment-level lifetime value. The averages do not just simplify; they actively mislead. Once you see the table above, your acquisition strategy, your support staffing, and your pricing roadmap all change.
How to Calculate Lifetime Value by Segment
The mechanics are straightforward once your segments exist. For each segment, gather three inputs and run the same formula.
- Average revenue per account, per segment. Pull revenue for the segment and divide by the number of customers in it. Do not use the global average.
- Churn rate, per segment. This is the input that varies most and matters most. Higher-value segments almost always churn slower, which compounds their advantage.
- Gross margin, per segment. If support cost differs by segment (enterprise often needs more hand-holding, but pays for it), reflect that here.
Run the numbers for each segment separately, then line them up side by side. The comparison is where the insight lives. You are looking for the segment with the best ratio of lifetime value to the cost of acquiring it.
If you already track the building blocks, this is fast. Revenue, churn, and margin are part of the core SaaS metrics every startup should track, so segmenting them is mostly a grouping exercise rather than new instrumentation.
Acting on the Gaps
Calculating segment lifetime value is only useful if it changes what you do. Three moves consistently pay off.
Reallocate acquisition spend. Direct more budget toward channels and campaigns that bring in your high-value segments, even if those channels look “expensive” on a cost-per-signup basis. A channel that delivers Enterprise customers at $400 each is a bargain against a $16,000 lifetime value. A channel delivering Starter signups at $40 each is a loss against a $133 lifetime value.
Tier your retention effort. Spend your best onboarding and customer-success energy on the segments worth the most. It is not elitist; it is arithmetic. Saving a 1% churn point in your Enterprise segment is worth orders of magnitude more than the same point in Starter.
Find your upgrade paths. The most profitable growth often comes from moving customers between segments. If a Starter customer can become a Growth customer, their lifetime value jumps from $133 to $1,200. Designing that upgrade journey is frequently a better investment than chasing brand-new signups.
Common Pitfalls
A few mistakes show up again and again when teams first build segment lifetime value.
- Using revenue instead of profit. Skipping gross margin overstates every number and leads to overspending on acquisition. Always run the margin step.
- Assuming churn is constant. Churn usually drops as customers age and as they move to higher tiers. A single global churn rate flattens this and undervalues your best segments.
- Forgetting expansion revenue. In many SaaS businesses, existing customers grow their spend over time. If you ignore expansion, you understate lifetime value for the segments most likely to grow.
- Building segments that are too granular. If a segment has thirty customers, its lifetime value is noise. Keep segments large enough to be statistically meaningful before you make budget decisions on them.
Start With Two Segments
If you have never done this, do not try to model a dozen segments at once. Split your customers into “high value” and “everyone else” using whatever signal you trust, then calculate lifetime value for each. Even that crude two-way split usually reveals a gap big enough to change a marketing decision.
From there you can refine: add plan tiers, acquisition channels, or industry. But the first split is what breaks the spell of the blended average. Once you have seen how differently your segments perform, you will never look at a single company-wide lifetime value the same way again.
FAQ
What is the difference between lifetime value and revenue per customer?
Revenue per customer is what someone pays you over a period. Lifetime value projects the total profit you expect across their entire relationship, accounting for how long they stay (churn) and how much it costs to serve them (margin). Lifetime value is the more decision-useful number because it sets your acquisition budget.
How do I calculate lifetime value for a single segment?
Use the same formula as the whole base, but with that segment’s own inputs: take the segment’s average revenue per account, multiply by its gross margin, and divide by its churn rate. The key is using segment-specific churn and revenue rather than global averages, because those are where segments differ most.
Why is blended lifetime value misleading?
A blended figure averages segments with very different economics, often hiding a 10x or larger gap between your best and worst customers. That average can make you overspend acquiring low-value customers and underinvest in your most profitable ones. Splitting lifetime value by segment exposes the gap so you can allocate budget correctly.
How many customers do I need per segment?
Enough that the churn and revenue figures are stable rather than swung by a few individuals. As a rough guide, keep segments large enough that adding or losing a handful of customers does not move the average meaningfully. If a segment is tiny, merge it with a similar one for calculation purposes.