8 Metrics Every SaaS Startup Should Track from Day One
You’ve launched your SaaS product. Users are signing up. Revenue is coming in. But when an investor asks about your...

You’ve launched your SaaS product. Users are signing up. Revenue is coming in. But when an investor asks about your...
You’ve launched your SaaS product. Users are signing up. Revenue is coming in. But when an investor asks about your unit economics or a board member wants to know your payback period, you’re scrambling to pull numbers from three different spreadsheets.
This is the reality for most early-stage SaaS founders — and it’s a problem that compounds. The metrics you track from day one shape the decisions you make, the story you tell investors, and ultimately whether your startup survives the transition from early traction to sustainable growth.
I’ve worked with SaaS companies from pre-revenue to Series B, helping them build analytics foundations. The pattern is consistent: teams that establish metric discipline early make better decisions and raise capital more efficiently. Teams that “figure it out later” spend months cleaning up data when they should be focused on growth.
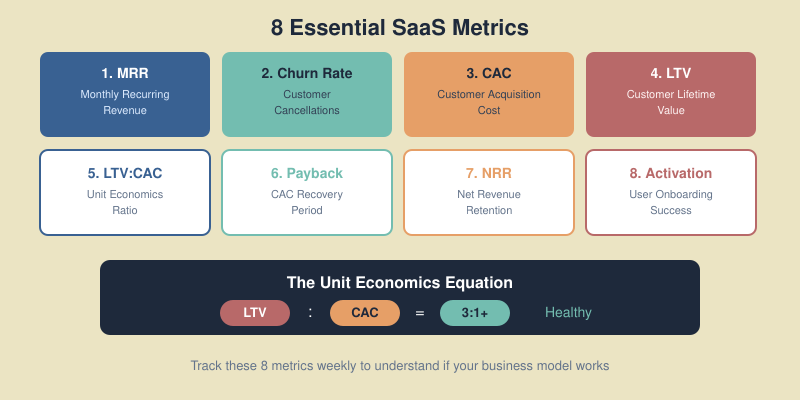
Here are the eight metrics every SaaS startup should track from day one — no more, no less. These aren’t vanity metrics. They’re the numbers that actually predict whether your business will work.
MRR is the heartbeat of your SaaS business. It’s the predictable revenue you can count on every month from active subscriptions.
Unlike one-time sales, MRR compounds. A 10% monthly growth rate doesn’t just add revenue — it creates a foundation that generates more revenue next month. This compounding effect is what makes SaaS businesses valuable.
MRR also tells you if your business model works. Growing MRR means customers find enough value to keep paying. Flat or declining MRR signals a fundamental problem with product-market fit or retention.
MRR = Number of customers × Average revenue per account (ARPA)
Or more precisely, sum the monthly value of all active subscriptions. Annual plans should be divided by 12.
Track MRR components separately:
This breakdown reveals whether growth comes from acquisition or expansion — critical for understanding your growth engine.

Churn is the percentage of customers who cancel their subscription in a given period. It’s the silent killer of SaaS businesses.
High churn creates a leaky bucket problem. You can pour unlimited customers in the top, but if they’re flowing out the bottom just as fast, you’ll never build a sustainable business. Applying conversion funnel optimization helps you identify exactly where and why customers drop off. Reducing churn often has a bigger impact on growth than increasing acquisition.
Monthly Churn Rate = (Customers lost in month / Customers at start of month) × 100
Be consistent about what counts as “lost” — cancellations, non-renewals, and failed payments all matter.
The 2025 average across SaaS is about 3.5% monthly churn. If you’re significantly above this, prioritize retention before scaling acquisition.

Track both. You might lose 10 small customers but retain your largest accounts, resulting in low revenue churn despite high customer churn. Revenue churn is often more meaningful for business health.
CAC is how much you spend to acquire a single new customer. It’s the foundation of understanding whether your growth is sustainable.
If it costs you $500 to acquire a customer who only pays you $200 over their lifetime, you’re literally paying people to use your product. Many startups have grown themselves into bankruptcy by ignoring CAC.
CAC = Total sales and marketing spend / Number of new customers acquired
Include everything: advertising, sales salaries and commissions, marketing tools, content production, events — all the costs required to acquire customers.
CAC varies dramatically by market and sales model:
The 2025 average CAC across B2B SaaS is around $702. But absolute CAC doesn’t matter as much as CAC relative to customer value — which brings us to LTV.
Not all acquisition channels are equal. Your Google Ads CAC might be $800 while organic content brings customers at $150. Track CAC by channel to allocate budget efficiently.
LTV is the total revenue you expect from a customer over their entire relationship with your company. It’s the other half of the unit economics equation.
LTV tells you how much you can afford to spend on acquisition while remaining profitable. A $10,000 LTV customer justifies a much higher CAC than a $500 LTV customer.
Simple formula:
LTV = ARPA × Customer Lifetime (in months)
Where customer lifetime = 1 / Monthly Churn Rate
More accurate formula:
LTV = ARPA × Gross Margin % × (1 / Monthly Churn Rate)
Including gross margin gives you the actual profit from each customer, not just revenue.
LTV alone isn’t meaningful — you need to compare it to CAC. But generally:
The LTV:CAC ratio is the ultimate test of your business model. It answers a simple question: can you profitably acquire customers?
A 3:1 LTV:CAC ratio is the industry gold standard. This means for every $1 you spend on acquisition, you generate $3 in lifetime value. Anything above 3:1 is considered healthy.
LTV:CAC Ratio = Customer Lifetime Value / Customer Acquisition Cost

| Ratio | Interpretation | Action |
|---|---|---|
| Less than 1:1 | Losing money on every customer | Stop spending on acquisition immediately |
| 1:1 to 2:1 | Marginally viable | Focus on reducing CAC or increasing LTV |
| 3:1 | Healthy business model | Continue optimizing, consider scaling |
| 5:1+ | Very efficient | May be underinvesting in growth |
If your ratio is below 3:1, don’t scale. Fix the fundamentals first — either reduce acquisition costs or improve retention and monetization.
CAC payback period measures how many months it takes to recover your customer acquisition cost from a customer’s payments.
Even with a healthy LTV:CAC ratio, a long payback period creates cash flow problems. If you spend $1,000 to acquire a customer but don’t recover that cost for 18 months, you need significant capital to fund growth.
CAC Payback Period = CAC / (ARPA × Gross Margin %)
This tells you the number of months until a customer becomes profitable.

Investors typically want to see CAC recovery in under 12 months. Longer payback periods require more capital to grow and increase risk.
Payback period directly impacts your runway. A 6-month payback means you can reinvest in acquisition twice per year. A 24-month payback means you’re waiting two years before that investment returns.
Annual prepayment plans dramatically improve payback by bringing revenue forward. A customer who pays annually upfront might generate positive cash flow immediately.
NRR measures how much revenue you retain and expand from your existing customer base, excluding new customer acquisition.
NRR above 100% means your existing customers generate more revenue over time through upgrades and expansion. This is the holy grail of SaaS — you can grow even without acquiring new customers.
High NRR indicates strong product-market fit and customer success. It also makes your business more resilient — you’re not entirely dependent on new acquisition.
NRR = (Starting MRR + Expansion - Contraction - Churn) / Starting MRR × 100
Calculate over a cohort period, typically 12 months.

Top-performing SaaS companies often have NRR above 120%. This means even with zero new customers, they’d still grow 20% annually.
Activation rate measures what percentage of new signups reach a meaningful milestone that predicts long-term retention — your “aha moment.”
Users who don’t activate rarely convert or retain. Your activation rate is a leading indicator of future churn and conversion. Improving activation often has cascading effects throughout your funnel.
Activation is specific to your product. Common activation milestones include:
The right activation metric correlates strongly with retention. Analyze your data to find which early actions predict long-term customers.
Activation Rate = (Users who completed activation milestone / Total new signups) × 100
Measure within a defined timeframe — typically 7, 14, or 30 days from signup.
Low activation usually points to onboarding friction, unclear value proposition, or attracting the wrong users. Reviewing customer segmentation examples can reveal whether you are targeting the right audience segments in the first place. It’s often the highest-leverage metric to improve in early-stage SaaS.
Don’t try to track everything in spreadsheets. As you grow, manual tracking breaks down. Set up proper infrastructure early.
Establish a regular rhythm:
Tracking too many metrics — Eight metrics is enough for early stage. Adding more creates noise and dilutes focus. Add complexity as you scale.
Inconsistent definitions — Define exactly what counts as a “customer,” how you calculate MRR, and what qualifies as “activated.” Document these definitions and stick to them.
Looking at metrics in isolation — LTV without CAC is meaningless. Churn without NRR misses expansion. Always consider metrics in relationship to each other.
Ignoring cohorts — Aggregate metrics hide important trends. Your overall churn might be 5%, but if recent cohorts churn at 8% while older cohorts churn at 3%, you have a growing problem.
Waiting too long to start — “We’ll figure out metrics when we’re bigger” leads to months of data cleanup. Start tracking properly from day one.
Start tracking immediately with whatever data you have. Even with 10 customers, you can calculate basic MRR and activation rate. Early data helps you establish trends and catch problems before they compound.
Track MRR for operational decisions — it’s more granular and responsive. Use ARR (MRR × 12) when communicating with investors or comparing to annual benchmarks. Most SaaS companies track both.
Review MRR and activation weekly. Do a full metrics review monthly. Conduct deep cohort analysis quarterly. Don’t obsess over daily fluctuations — they’re mostly noise.
Usually reducing churn. A 1% improvement in churn often has a bigger long-term impact than a 1% improvement in acquisition, especially as you scale. Fix the leaky bucket before pouring more water in.
Add metrics when you have specific questions they answer or when you scale past early-stage. Series A companies might add metrics like sales cycle length, expansion rate, or support ticket volume. Start simple, add complexity gradually.
These eight SaaS metrics — MRR, churn, CAC, LTV, LTV:CAC ratio, payback period, NRR, and activation rate — form the foundation of understanding whether your business model works.
You don’t need complex BI tools or a data team to start. A well-structured spreadsheet tracking these eight metrics weekly gives you more insight than most funded startups have. The key is consistency: track the same metrics the same way, every week, from day one.
When investors ask about your unit economics, you’ll have clear answers. When you need to decide between investing in acquisition or retention, the data will guide you. When something breaks, you’ll catch it early instead of discovering the problem months later.
Your next step: Open a spreadsheet and set up tracking for MRR and churn this week. Add CAC and LTV next week. Within a month, you’ll have all eight metrics in place and a clearer picture of your business than most founders ever achieve.
Honest reviews of analytics tools, SEO tactics that actually work, and growth strategies for bootstrapped SaaS — no fluff, no affiliate bias.