Marketing Attribution Models — The Honest Guide (No Vendor Spin)
Every marketing team I’ve worked with has the same problem: they’re making budget decisions based on attribution data that’s lying...
Every marketing team I’ve worked with has the same problem: they’re making budget decisions based on attribution data that’s lying...
Every marketing team I’ve worked with has the same problem: they’re making budget decisions based on attribution data that’s lying to them. Not because the tools are broken — but because marketing attribution models are, by design, simplifications of messy reality.
Last-click attribution tells your CEO that branded search “drives” 60% of revenue. First-touch says it’s all about blog posts. Linear attribution spreads credit so evenly it’s meaningless. And the vendor selling you their “AI-powered” model? They have their own incentives.
This guide is different. I won’t rank models from worst to best — because that framing is wrong. Instead, I’ll show you what each model reveals, what it hides, and how to triangulate toward the truth using a combination of attribution, incrementality testing, and marketing mix modeling. After a decade of building traffic analysis and measurement systems for SaaS and content businesses, this is the framework I keep coming back to.

An attribution model is a set of rules for assigning credit to marketing touchpoints that preceded a conversion. That’s it. It’s not a truth machine — it’s a credit assignment system.
Think of it like splitting a restaurant bill. Did the appetizer contribute to the meal experience? Yes. Did dessert? Yes. But how much credit does each dish deserve for the overall satisfaction? There’s no objectively correct answer — only different frameworks for dividing the check.
The critical distinction most guides miss: attribution measures correlation, not causation. When your last-click report says Google Ads drove $50,000 in revenue, it means $50,000 in conversions happened after someone clicked a Google ad. It does NOT mean that $50,000 disappears if you turn off Google Ads. Some of those buyers would have found you anyway.
This gap between “gets credit” and “actually caused” is where millions of marketing dollars get wasted every year.
Before we get into why models fail, let’s make sure we speak the same language. Here are the six attribution models you’ll encounter in GA4, ad platforms, and third-party tools:
First-Touch Attribution gives 100% credit to the first interaction. If a customer first discovers you through an organic blog post, then later clicks a retargeting ad, then searches your brand name and buys — the blog post gets all the credit. This model favors awareness channels and content marketing.
Last-Touch Attribution gives 100% credit to the final interaction before conversion. In the same journey, branded search gets all the credit. This model favors bottom-of-funnel channels and brand search. It’s the default in most platforms because it’s simple and flatters the platform showing you the report.
Linear Attribution splits credit equally across all touchpoints. Three touchpoints? Each gets 33.3%. This sounds fair but treats a random display impression the same as a high-intent product demo.
Time-Decay Attribution gives more credit to touchpoints closer to conversion. The logic: recent interactions are more influential. This works well for short sales cycles but undervalues the awareness channels that started the journey.
Position-Based (U-Shaped) Attribution gives 40% to first touch, 40% to last touch, and splits the remaining 20% among middle interactions. This is a popular compromise — it values both discovery and closing while acknowledging the middle.
Data-Driven (Algorithmic) Attribution uses machine learning to analyze your actual conversion paths and assign credit based on statistical patterns. Google’s data-driven attribution in GA4 does this automatically. It’s the most sophisticated option, but it’s a black box — you can’t see why it assigns credit the way it does, and it needs significant conversion volume (typically 300+ conversions per month) to work reliably.

This is the section most attribution guides skip entirely. Every model produces a distorted view of reality. Here’s how, with specific scenarios.
Scenario: You run a podcast ad campaign for three months. Listeners hear your brand name, Google it later, and buy. Last-click gives 100% credit to branded search. Your report says: “Branded Google Ads drove $200K this quarter.” You cut the podcast budget because it “doesn’t convert.” Next quarter, branded search revenue drops 40% because nobody is hearing about you anymore.
I’ve watched this exact pattern destroy a SaaS company’s growth. They cut all top-of-funnel spend because last-click said it wasn’t working. Twelve weeks later, their pipeline collapsed. The lesson: last-click measures the last step, not the reason someone took it.
Scenario: Someone reads your blog post, then receives 14 emails, attends a webinar, talks to sales twice, and finally buys. First-touch gives the blog post 100% credit. Your team concludes: “Content marketing is our best channel!” Meanwhile, the email nurture sequence and sales team — which actually closed the deal — get zero credit.
Scenario: A customer’s journey has 12 touchpoints, including 6 display ad impressions they probably never noticed. Linear attribution gives each touchpoint 8.3% credit, treating an invisible banner the same as a product demo that answered their buying questions. This inflates the value of high-volume, low-impact channels.
Algorithmic models are only as good as the data they train on. If your tracking misses offline touchpoints, underestimates word-of-mouth, or loses users across devices, the algorithm builds its model on an incomplete picture. Garbage in, sophisticated garbage out. And because it’s a black box, you can’t audit the assumptions.

If every model lies, how do you find the truth? The answer isn’t a better model — it’s triangulation. Modern measurement uses three complementary methods, each covering the others’ blind spots.
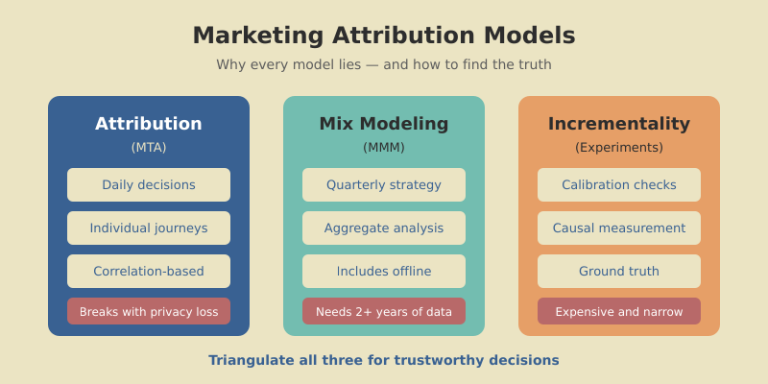
Multi-Touch Attribution (MTA) tracks individual user journeys and assigns credit to touchpoints. It’s granular and real-time, but it only sees digital interactions, breaks with cookie restrictions, and measures correlation.
Marketing Mix Modeling (MMM) uses aggregate statistical analysis (regression) to measure how spend across channels correlates with outcomes over time. It handles offline media and isn’t affected by cookie loss, but it requires 2+ years of data, updates quarterly at best, and can’t optimize individual campaigns.
Incrementality Testing measures causation directly. You run controlled experiments — showing ads to a test group and withholding them from a control group — then measure the difference. It’s the closest thing to ground truth, but it’s expensive, time-consuming, and only answers one question at a time.
Think of it this way: MTA is your daily dashboard (fast but noisy), MMM is your quarterly strategy review (slow but comprehensive), and incrementality is your spot-check calibration (precise but narrow). You need all three — or at minimum, two of the three — to make decisions you can trust. This same principle applies to conversion funnel optimization: no single metric tells the full story.

Incrementality sounds intimidating, but the basic version is straightforward. Here’s a framework I’ve used with teams that don’t have dedicated data scientists.
Step 1: Pick one channel and one question. Don’t try to test everything. Start with your biggest uncertainty. Example: “Does our Facebook retargeting actually drive incremental revenue, or are these people who would buy anyway?”
Step 2: Create a holdout group. Split your retargeting audience randomly: 85% see ads (test group), 15% don’t (control group). Most ad platforms support this natively — Facebook calls it “conversion lift,” Google calls it “brand lift studies.”
Step 3: Run for 2-4 weeks. You need enough time and conversions for statistical significance. A rule of thumb: at least 100 conversions in each group.
Step 4: Compare conversion rates. If the test group converts at 4.2% and the control group at 3.1%, your incremental lift is 1.1 percentage points. That means roughly 26% of your retargeting “conversions” are truly incremental — the rest would have happened without the ads.
Step 5: Recalibrate your attribution. If your attribution model says retargeting drove $100K this quarter, but incrementality shows only 26% is truly incremental, the real value is closer to $26K. That’s a massive difference for budget allocation.
One of the most eye-opening tests I ran was for a B2B SaaS client. Their attribution said branded search drove 55% of signups. We paused branded ads for two weeks in one geo. Organic clicks absorbed 89% of the lost paid traffic. The true incremental value of branded search ads was about 11% — not 55%. They reallocated $30K/month to top-of-funnel content that actually expanded the audience.

There’s no universally “best” model. The right choice depends on your business maturity, sales cycle, and what decisions you’re trying to make. Here’s a practical framework.
If you’re early-stage (under $1M ARR, small team): Use last-click for operational decisions (which campaigns to pause today) but supplement with first-touch reports monthly to understand what’s filling the top of the funnel. Don’t overcomplicate it — your biggest risk is not tracking at all, not using the wrong model.
If you’re growth-stage ($1M-$10M ARR): Move to position-based (U-shaped) attribution as your default view. It balances discovery and conversion credit. Start running quarterly incrementality tests on your top 2-3 channels. Build a simple marketing dashboard that shows both attributed revenue and incrementality-adjusted revenue side by side.
If you’re scaling ($10M+ ARR, multi-channel): Use data-driven attribution as your daily lens, commission an MMM study annually, and run incrementality tests monthly on your highest-spend channels. The triangulation approach pays for itself at this scale because misallocating even 10% of a multi-million dollar budget is hundreds of thousands wasted.
Regardless of stage, track your UTM parameters religiously. No attribution model can work if the underlying tracking data is broken.

The attribution landscape has fundamentally shifted. iOS App Tracking Transparency, GDPR enforcement, third-party cookie deprecation, and consent management have broken the tracking chain that multi-touch attribution depends on. Here’s what’s changed and how to adapt.
What’s broken: Cross-device tracking, third-party cookies, and view-through attribution are all unreliable now. If a customer browses on their phone, researches on their laptop, and buys on their work computer, MTA often sees three separate people. Studies estimate that current MTA tools miss 20-40% of touchpoints due to privacy restrictions.
What still works: First-party data (your own site, CRM, email) remains fully trackable. Server-side tracking recovers some lost signals. And methods that don’t rely on individual tracking — MMM and geo-based incrementality tests — are actually gaining accuracy because they never depended on cookies in the first place.
The practical shift: Privacy-first attribution means moving from “track every click” to “measure outcomes at the cohort level.” Instead of knowing that User #47382 saw three ads and bought, you measure: “We increased Facebook spend 20% in Region A but not Region B. Region A conversions grew 12% more. Facebook’s incremental impact is roughly 12%.” This is less granular but more honest — and it works regardless of cookie settings.
Before investing in new tools or models, audit what you have. This takes five minutes and reveals whether your current attribution data is trustworthy.
Check 1: Channel overlap. Look at assisted conversions in GA4 (Reports → Advertising → Attribution paths). If “Direct” appears in more than 40% of paths, your tracking has gaps — real direct traffic is rare, so “Direct” usually means “we don’t know where this came from.”
Check 2: Model divergence. In GA4, compare the same date range under different attribution models (last-click, first-click, data-driven). If a channel’s credit swings more than 50% between models, that channel is the one worth running an incrementality test on.
Check 3: Platform agreement. Compare what Google Ads claims it drove versus what GA4 attributes to Google Ads. If there’s more than a 30% gap, your conversion tracking or attribution window settings need attention.
Check 4: Time lag. Check your conversion paths for average time to conversion. If most conversions take 14+ days but your attribution window is 7 days, you’re systematically undercounting channels that start long journeys.
Check 5: The gut check. Show your attribution report to someone who doesn’t manage ads. If “brand search” or “direct” dominate and they say “that doesn’t sound right” — they’re probably correct. Human intuition about your business is a useful sanity check against model outputs.
There is no single best model. Position-based (U-shaped) is the most balanced starting point for most businesses because it credits both discovery and conversion touchpoints. However, the real answer is to use multiple models and compare them — the divergence between models is more informative than any single model’s output.
Attribution measures correlation — which touchpoints preceded a conversion. Incrementality measures causation — what happens when you turn a channel off. Attribution tells you who gets credit; incrementality tells you what actually works. Both are valuable, but incrementality is closer to ground truth.
Yes, but keep it simple. Start with last-click for daily optimization and first-touch for monthly pipeline analysis. Focus energy on clean tracking (proper UTM parameters, consistent naming conventions) rather than sophisticated models. Clean data in a simple model beats messy data in an advanced one.
Privacy changes have reduced the accuracy of individual-level tracking by an estimated 20-40%. The shift is toward aggregate measurement methods — marketing mix modeling and geo-based incrementality tests — that don’t rely on tracking individual users. First-party data from your own properties has become the most reliable tracking signal.
Review your attribution setup quarterly. Check for model divergence, platform discrepancies, and whether your chosen model still matches your channel mix. Run incrementality tests on your highest-spend channel at least twice a year to calibrate your attribution against real causal data.
Honest reviews of analytics tools, SEO tactics that actually work, and growth strategies for bootstrapped SaaS — no fluff, no affiliate bias.
