Website Traffic Analysis — A Practitioner’s Playbook for 2026
What Web Traffic Analysis Actually Tells You (Beyond Pageviews) Most marketers open their analytics dashboard, glance at pageviews, and move...
What Web Traffic Analysis Actually Tells You (Beyond Pageviews) Most marketers open their analytics dashboard, glance at pageviews, and move...
Most marketers open their analytics dashboard, glance at pageviews, and move on. That’s like checking the odometer on your car without ever looking at the fuel gauge, engine temperature, or speed. You know something happened, but you have no idea what it means.
Web traffic analysis is the practice of collecting, measuring, and interpreting visitor data to make better marketing and product decisions. It answers three questions that actually matter: where are visitors coming from, what are they doing on your site, and why are they leaving without converting?
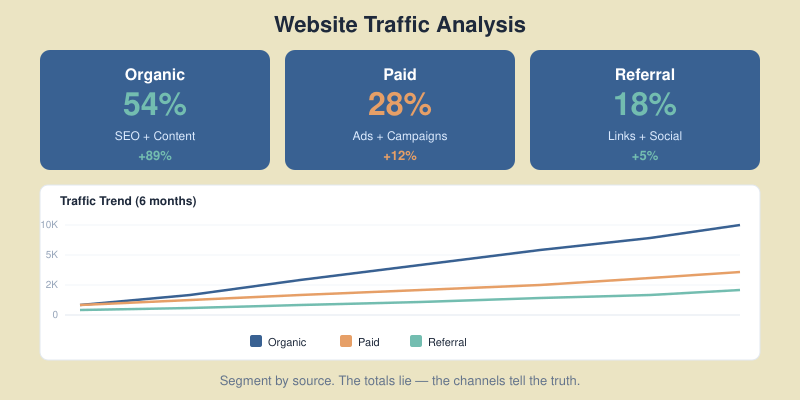
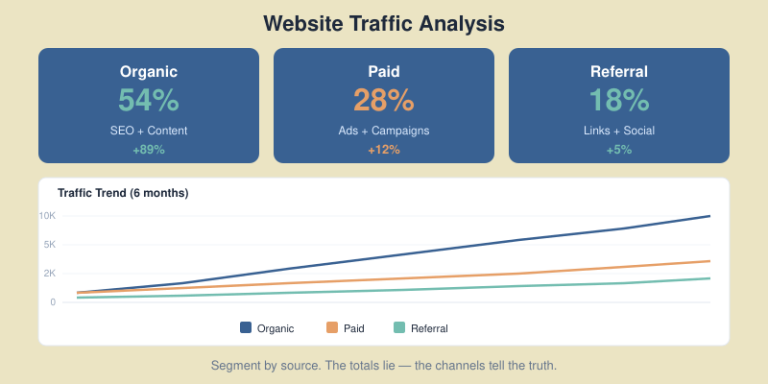
When I started analyzing traffic for my first SaaS client in 2017, I made the classic mistake — I obsessed over total sessions. The number went up every month, but revenue stayed flat. The problem was obvious once I dug deeper: 60% of the traffic came from irrelevant keywords, and the visitors who actually mattered were bouncing from the pricing page. The raw numbers told a success story. The segmented data told the truth.
The difference between reporting traffic and analyzing it is interpretation. Reporting says “we had 50,000 sessions.” Analysis says “organic sessions from bottom-funnel keywords grew 23%, but our paid traffic has a 78% bounce rate on mobile — we’re wasting budget on a broken landing page.”

Not all metrics deserve your attention. After working with dozens of sites across SaaS, content, and ecommerce, I’ve narrowed it down to seven metrics that consistently lead to action — not just observation.
1. Sessions by source/medium. This is your traffic mix. It tells you where growth is coming from and where you’re vulnerable. If 70% of traffic is organic, one algorithm update could cut your pipeline in half. A healthy mix balances organic, direct, referral, and paid channels.
2. Engagement rate. GA4 replaced bounce rate with engagement rate — the percentage of sessions that lasted longer than 10 seconds, had a conversion event, or viewed 2+ pages. This is a far better signal of content quality than the old bounce rate.
3. Conversion rate by source. Not all traffic converts equally. Organic visitors from long-tail keywords often convert at 3-5x the rate of social media traffic. Track this by source to allocate budget where it actually drives revenue.
4. Pages per session. For content sites, this reveals whether your internal linking works. For SaaS, it shows if visitors explore your product pages or leave after the blog post. Anything above 2.0 is a solid baseline.
5. Average session duration. Context matters here. A 45-second session on a pricing page might be perfectly fine — the visitor found the answer. A 45-second session on a 2,000-word guide means they didn’t read it. Always pair duration with page type.
6. New vs returning visitors. A content site should aim for 25-35% returning visitors. Lower means your content isn’t sticky. Higher might mean you’re not attracting new audiences. For SaaS, returning visitors to your product pages are strong buying signals.
7. Exit pages. Forget the homepage — look at which pages people leave from most. If your pricing page has the highest exit rate, that’s where friction lives. If it’s your signup confirmation page, that’s expected. Context separates useful data from noise.

Knowing which metrics matter is half the battle. Here’s the exact workflow I use when I sit down to analyze a site’s traffic — whether it’s for a client audit or my own projects.
Step 1: Start with the big picture (7-day and 30-day trends). Open GA4 and compare the last 30 days to the previous 30. Look for anomalies — traffic spikes, sudden drops, or shifts in source mix. Don’t explain anything yet, just observe.
Step 2: Break down by source/medium. In GA4’s Traffic Acquisition report, sort by sessions. Identify your top 5 sources and check if each one is growing, flat, or declining. Pay special attention to organic — if it dropped, check Google Search Console for indexing issues or ranking changes.
Step 3: Check engagement by landing page. Go to Pages and Screens, sort by sessions, and add engagement rate as a column. Your top 10 landing pages should all have engagement rates above 50%. Anything below 40% is a red flag — the page isn’t delivering what the visitor expected.
Step 4: Follow the money. If you have conversions set up, filter by conversion events. Which sources drive the most conversions? Which landing pages? This is where you stop looking at traffic as a vanity metric and start seeing it as a revenue driver. For campaign-level tracking, proper UTM parameters make this analysis possible.
Step 5: Identify drop-off points. Use GA4’s funnel exploration to map the path from landing page to conversion. Where do visitors leave? A high drop-off between product page and pricing page suggests a value communication problem. Between pricing and signup? Price objection or trust issue.
Step 6: Segment and compare. Never analyze all traffic as one blob. Segment by device (mobile vs desktop often tells wildly different stories), by geography, or by new vs returning users. I once found that a client’s mobile conversion rate was 0.3% versus 4.1% on desktop — the mobile checkout was broken, and nobody had noticed because the overall rate looked “fine.”
Step 7: Document and act. Write down three findings and three actions. Not ten. Not twenty. Three findings, three actions. Track them in your marketing dashboard and revisit next week.

You don’t need expensive website traffic analysis tools to get actionable insights. You need the right combination for your stage and budget. Here are three stacks I’ve used and recommend — from bootstrapped to well-funded.
This covers 80% of what most sites need. Google Analytics 4 handles traffic and behavior data. Google Search Console covers organic search performance — impressions, clicks, average position. Looker Studio connects both into a single dashboard. And Microsoft Clarity adds heatmaps and session recordings for free, with no traffic limits.
The tradeoff: GA4 has a steep learning curve, data sampling kicks in on large sites, and Google owns your data. But for most sites under 500K monthly sessions, this stack works.
Replace or supplement GA4 with a privacy-first platform like Plausible (€9/month) or Fathom (€14/month). These are lightweight, GDPR-compliant by default, and don’t require cookie consent banners — which means you capture 100% of visits instead of only the visitors who click “Accept.” Add Matomo if you need full event tracking and funnel analysis without sending data to third parties.
For competitive intelligence, SimilarWeb‘s free tier gives rough traffic estimates for competitors. Not accurate enough for decisions, but useful for directional benchmarking.
At this level, add dedicated traffic tools for specific jobs. Semrush or Ahrefs for organic traffic analysis and keyword tracking. Hotjar or FullStory for behavioral analytics. Mixpanel or Amplitude for product analytics in SaaS. And a data warehouse (BigQuery) if you need to blend traffic data with revenue data from your CRM.
My honest take: most sites stay at the Growth Stack far longer than they think they need to. Don’t over-tool. Start simple, add when you hit a specific question your current stack can’t answer.
SEO traffic analysis deserves its own section because organic is usually the highest-converting, lowest-cost channel — and the hardest to read correctly.
Start in Google Search Console, not GA4. GSC shows you what happened in Google’s search results before the click: impressions, click-through rate, and average position. GA4 only sees what happens after the click. You need both perspectives.
Here’s what I check weekly:
One pattern I see constantly: sites with strong technical SEO foundations — proper XML sitemaps, clean site architecture, structured data markup — recover faster from algorithm updates. Technical SEO isn’t glamorous, but it’s insurance.
For deeper organic analysis, connect GSC to Looker Studio and build a report that shows organic landing pages alongside their conversion rates from GA4. This tells you which keywords actually drive business, not just traffic.
For your own site, the data lives in your analytics platform. But what if you need to find website traffic data for competitors, potential partners, or market sizing?
Let me be honest about accuracy first. Third-party traffic estimation tools are directionally useful but never precise. In my testing, SimilarWeb’s estimates were within 20-30% of actual traffic for sites above 100K monthly visits — and wildly off for smaller sites. Ahrefs and Semrush are more reliable for organic traffic estimates because they model from keyword ranking data, but they still miss branded search and long-tail variations.
Here’s how I approach competitive traffic research:
For organic traffic estimates: Use Ahrefs’ “Site Explorer” or Semrush’s “Domain Overview.” Look at organic traffic trends over 12+ months, not snapshots. A competitor growing 15% month-over-month in organic traffic is investing heavily in content — pay attention.
For total traffic estimates: SimilarWeb gives the broadest picture — organic, paid, social, referral, and direct. The free version shows top-level numbers. Cross-reference with Ahrefs’ organic estimate to sanity-check.
For content gap analysis: Ahrefs’ “Content Gap” tool shows keywords your competitors rank for that you don’t. This is where traffic analysis turns into strategy — you’re identifying exactly where the opportunity sits.
For market sizing: Combine SimilarWeb data for 5-10 competitors in your niche. Sum their estimated traffic, and you have a rough addressable audience size. Not precise, but good enough for planning your content distribution strategy.

Theory is useful. Practice is better. Here’s a condensed version of a site traffic analytics audit I ran for a B2B SaaS client last quarter — anonymized, but the numbers are real.
The situation: 45,000 monthly sessions, primarily organic (62%). The marketing team was celebrating growth. Revenue from inbound leads was flat for 6 months.
Finding 1: Wrong traffic, right volume. Their top 10 organic landing pages drove 70% of traffic but only 12% of demo requests. The high-traffic pages ranked for informational keywords (“what is X”) while their product-comparison pages — which converted at 8.2% — sat on page 2 of Google.
Finding 2: Mobile was a dead zone. Mobile traffic was 38% of total sessions but accounted for just 4% of conversions. The demo request form required 11 fields and didn’t auto-fill on mobile browsers. Desktop conversion rate: 3.8%. Mobile: 0.4%.
Finding 3: Paid traffic was leaking. Their Google Ads drove 5,200 sessions per month to two landing pages. One converted at 6.1%. The other at 0.9%. Same budget split. Simply reallocating budget to the winning page was the fastest revenue win.
The actions: (1) Rewrote and expanded the product-comparison pages with fresh data and FAQ schema markup to target featured snippets. (2) Reduced the mobile form to 4 fields. (3) Shifted 80% of ad budget to the high-converting landing page. Results after 90 days: demo requests up 41%, cost per lead down 34%.
The point isn’t to share my results — it’s to show that the audit workflow matters more than the tools. GA4, Search Console, and a spreadsheet were all we used.
The analytics landscape has shifted fundamentally. Safari and Firefox block third-party cookies by default. Google Chrome is pushing the Privacy Sandbox. The EU’s ePrivacy regulations keep tightening. If you still rely entirely on cookie-based analytics, you’re probably missing 20-40% of your actual traffic.
Here’s the practical reality in 2026:
Cookie consent affects data completeness. On European sites using GA4 with a consent banner, typically only 55-75% of visitors accept cookies. That means your traffic numbers in GA4 are systematically undercounted. Privacy-first tools like Plausible and Fathom don’t use cookies at all, so they capture every visit — no consent banner needed.
Server-side tracking is becoming the default. Instead of loading a JavaScript tag in the browser (which ad blockers can block), server-side tracking sends data from your server directly to the analytics platform. It’s more reliable, more private, and harder to block. Google Tag Manager supports server-side containers, and Matomo can self-host entirely.
First-party data is king. The shift away from third-party cookies makes your own first-party data more valuable than ever. Email subscribers, logged-in users, CRM data — these are your most reliable data sources. Build your analytics around first-party relationships, not borrowed audiences.
My recommendation for 2026: run GA4 for depth and a cookieless tool (Plausible or Fathom) for accuracy. Compare the numbers monthly. The delta between them is your “consent gap” — and it’s growing every year.
Even experienced marketers fall into these traps. I’ve made every one of them at some point.
Mistake 1: Not filtering internal traffic. If your team visits the site 200 times a day during development or content review, that’s noise in your data. Set up IP filters in GA4 or use the internal traffic identification feature. It takes 2 minutes and saves months of dirty data.
Mistake 2: Ignoring referral spam. Check your referral sources monthly. If you see domains you don’t recognize driving hundreds of sessions with 100% bounce rates, that’s referral spam. Exclude them via GA4 filters.
Mistake 3: Measuring the wrong conversions. A “conversion” in GA4 is whatever you define it as. If your only conversion event is “purchase” but you’re a content site, you’ll think nothing converts. Define micro-conversions: email signups, scroll depth thresholds, content downloads, key SaaS events like trial starts.
Mistake 4: Comparing incomparable time periods. Don’t compare December traffic to January traffic and conclude “traffic dropped.” Seasonality is real. Always compare year-over-year, or at minimum, control for seasonal patterns.
Mistake 5: Chasing vanity metrics. Total pageviews, total sessions, social media followers — these feel good but rarely correlate with revenue. Focus on metrics tied to business outcomes: conversion rate by source, revenue per session, cost per acquisition.
Google Analytics 4 combined with Google Search Console covers most needs. GA4 tracks on-site behavior and conversions, while Search Console shows organic search performance. Add Microsoft Clarity for free heatmaps and session recordings. This stack costs nothing and handles sites up to 500K monthly sessions without data sampling issues.
Check high-level trends weekly — a 10-minute review of source mix, top pages, and conversion rates catches problems early. Do a deep analysis monthly, comparing 30-day periods and investigating anomalies. Run a full audit quarterly, reviewing segments, attribution, and content performance against business goals.
Tools like SimilarWeb, Semrush, and Ahrefs provide directional estimates, not exact numbers. For sites above 100K monthly visits, SimilarWeb is typically within 20-30% of actual traffic. For smaller sites, the margin of error increases significantly. Use them for competitive benchmarking and trend spotting, never for precise planning.
The average engagement rate across industries is 55-65%. Content sites typically see 45-55% (many visitors read one article and leave). SaaS product pages should aim for 65-75%. Ecommerce sites average 55-65%. Anything consistently below 40% on a key landing page signals a mismatch between visitor expectations and page content.
Ideally, both. GA4 offers unmatched depth — funnel analysis, audiences, predictive metrics, and free BigQuery export. Privacy-first tools like Plausible or Fathom capture visitors who decline cookies (typically 25-45% of European audiences), giving you more accurate total counts. Running both gives you depth from GA4 and completeness from the cookieless tool.
Honest reviews of analytics tools, SEO tactics that actually work, and growth strategies for bootstrapped SaaS — no fluff, no affiliate bias.