Customer Segmentation Examples — How to Build Segments That Actually Work
Most customer segmentation guides give you a list of 20+ examples with a one-sentence description each. Neat for skimming, useless...

Most customer segmentation guides give you a list of 20+ examples with a one-sentence description each. Neat for skimming, useless...
Most customer segmentation guides give you a list of 20+ examples with a one-sentence description each. Neat for skimming, useless for implementation. You finish reading and still have no idea how to actually build any of those segments.
This guide takes the opposite approach. Fewer examples, more depth. Each one includes what the segment is, how to build it in your analytics tool, how to validate it is large enough to matter, and how to measure whether it is actually driving revenue. I have used every one of these segments with real clients — SaaS products, ecommerce stores, and content businesses.
If you have already read our guide on audience segmentation strategy, this is the practical companion piece. Less theory, more copy-and-implement examples.

Before jumping into examples, let us define the baseline. What are customer segments? They are groups of customers who share meaningful characteristics — behaviors, demographics, purchase patterns, or engagement levels — that justify treating them differently in your marketing, product, or support strategy.
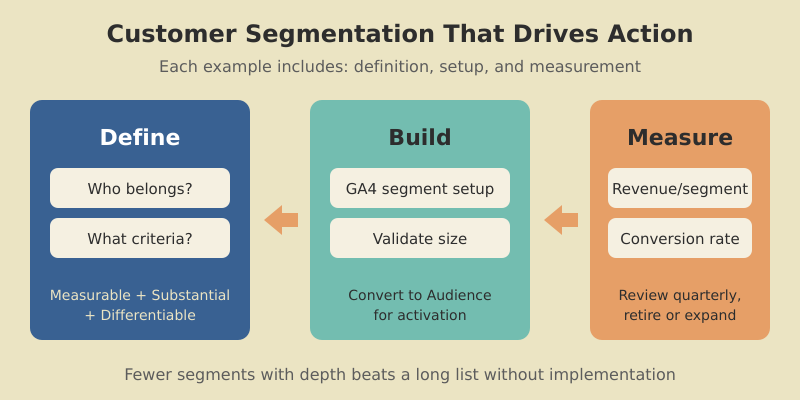
The key word is “actionable.” A segment is only useful if it meets three criteria:
A segment like “users aged 25-34 in California” is measurable and might be substantial, but if they behave identically to users aged 35-44 in California, it is not differentiable — and therefore not actionable. Always validate that your segments actually behave differently before investing in segment-specific strategies.

There are many ways to slice your customer base, but most practical segmentation falls into five types of customer segments. Each type answers a different question about your customers.
Based on who your customers are: age, location, company size, industry, job role. Most accessible data but lowest predictive power on its own. Best used as a first filter combined with behavioral data.
Based on what customers do: features used, pages visited, purchase frequency, support interactions. This is the highest-signal type for most digital businesses. A user who logged in 15 times last month is fundamentally different from one who logged in once.
Based on how much customers are worth: revenue generated, lifetime value, plan tier, expansion potential. Essential for prioritizing where to allocate resources — your top 20% of customers likely generate 60-80% of revenue.
Based on where customers are in their journey: new, onboarding, activated, mature, at-risk, churned. Each stage requires different communication and different funnel optimization strategies.
Based on what customers are trying to accomplish: their goals, pain points, and use cases. Harder to identify but incredibly powerful for product development and messaging. Typically discovered through surveys, support analysis, and user interviews.
Knowing the types is one thing. Knowing the practical ways to segment customers is another. Here are three methods I use repeatedly.

Score every customer on three dimensions: Recency (when did they last engage?), Frequency (how often do they engage?), and Monetary value (how much have they spent?). Each dimension gets a score of 1-5. A customer scoring 5-5-5 is a “Champion.” A customer scoring 1-3-5 is a “Can’t Lose Them” — high-spending but disengaging.
RFM works exceptionally well for ecommerce and subscription businesses. I implemented it for a DTC brand, and it immediately revealed that 8% of customers generated 43% of revenue — and half of those high-value customers had not purchased in 60+ days. One targeted win-back campaign recovered $47K in the first month.
Group customers by the actions they take (or do not take) within specific timeframes. For SaaS: “completed onboarding within 3 days” vs. “took longer than 7 days.” For ecommerce: “purchased within first visit” vs. “needed 3+ sessions.” The behavior that happens early in the customer journey often predicts long-term value.
Segment by the problem customers are solving, not their demographics. A project management tool might have customers using it for client work, internal team coordination, and personal task management — three completely different jobs that require different onboarding, features, and messaging. Identify these through product usage patterns and customer interviews.
Here are customer segments examples I have built for SaaS products, with specific implementation details.

Definition: Signed up in the last 7 days, completed at least 2 of 5 onboarding steps, but have not hit the activation event (e.g., created their first project, sent their first campaign).
Why it works: These users showed intent but got stuck. A targeted nudge at this moment has the highest conversion impact. PocketSuite used a similar segment and reduced churn by 30%.
GA4 setup: Create a User segment where sign_up event occurred in the last 7 days AND onboarding_step count is between 2 and 4 AND activation_event count is 0.
Definition: Logged in 10+ times per month for the past 3 months, but login frequency dropped below 3 in the current month.
Why it works: These are your most engaged users showing disengagement signals. Losing a power user costs 5-10x more than losing a casual user because they are typically on higher plans and influence team adoption.
GA4 setup: Build a predictive audience using the “likely to churn in 7 days” model, filtered to users with historically high engagement scores.
Definition: Using 80%+ of their plan’s feature limits (seats, storage, API calls), logged in by multiple team members, and on a plan for 3+ months.
Why it works: These accounts are ready for an upgrade conversation. They have proven product value and are hitting natural usage ceilings. Baremetrics used value-based segmentation like this to grow MRR by 20%.
Action: Trigger an in-app message showing usage relative to limits, plus a one-click upgrade path.
The same principles apply outside SaaS. Here are user segmentation examples for ecommerce and content businesses.

Definition: Customers who made exactly one purchase vs. those with two or more purchases.
Why it works: The marketing strategy is completely different. First-time buyers need trust-building and a reason to return. Repeat buyers need loyalty rewards and cross-sell offers. Sur La Table segmented this way and saw a 6% lift in conversion rates and 12% more product page views.
GA4 setup: Create two audiences — one where purchase event count equals 1, another where it is greater than 1. Export both to Google Ads for differentiated remarketing.
Definition: Users who added items to cart but did not purchase, segmented into three tiers: under $50, $50-$200, and $200+.
Why it works: A $20 cart abandoner might respond to free shipping. A $200+ abandoner might need a phone call or live chat. Different recovery tactics for different value tiers dramatically improve recovery rates.
Action: Under $50 gets an automated email with a free shipping code. $50-$200 gets a 10% discount. $200+ gets a personal outreach from sales within 24 hours.
Definition: Blog readers who visit 3+ articles, then view a product or pricing page within 30 days.
Why it works: These are your content-qualified leads. They have self-educated through your content and are now evaluating your product. This segment converts at 3-5x the rate of direct traffic because they arrive with context and trust.
GA4 setup: Build a sequential segment: Step 1 is page_view where path contains “/blog/” (count ≥ 3), followed by Step 2 page_view where path contains “/pricing” or “/product”, within 30 days.
Knowing the examples is half the battle. Actually segmenting customer groups in your analytics tool is the other half. Here is the practical workflow I follow in GA4.
Start in Explore → New Exploration → Free-form. Click “+” next to Segments. For each of the examples above, you are creating either a User segment (tracks individuals across sessions) or a Session segment (tracks specific visits).
The key settings that most guides skip:
Once validated in Explorations, convert segments to Audiences for ongoing use. Audiences update in real-time and can be exported to Google Ads. I recommend building your traffic analysis foundation first — clean event tracking makes segmentation far more reliable.
Individual segments are useful. A complete customer segmentation strategy example shows how segments work together. Here are two complete models.

This model covers the full customer lifecycle:
Every customer falls into exactly one segment at any time. Track movement between segments weekly on your marketing dashboard — the flow between segments tells you more than any individual metric.
The critical metric is migration rate: what percentage of Browsers become First-Time Buyers? What percentage of First-Time Buyers make a second purchase? Industry benchmarks suggest 27% of first-time buyers return for a second purchase. If your rate is below 20%, focus all effort there — it is your biggest growth lever.

After building segmentation models for dozens of clients, I see the same mistakes repeatedly.
Too many segments, too soon. Starting with 12 segments when your team can only execute personalized campaigns for 3. Each segment needs distinct messaging, offers, and measurement. Start with 3-5 and expand only when you are consistently activating every segment.
Segmenting on demographics alone. Company size and job title are easy to collect but poor predictors of behavior. A Series A startup CTO and a Fortune 500 CTO have vastly different needs. Layer behavioral data on top of demographics — what they do matters more than who they are.
Never retiring segments. Customer behavior changes. A segment that performed well last year might be irrelevant now. Review quarterly: merge segments that have converged, split segments that have become too broad, and retire segments smaller than 100 members.
Ignoring negative segments. Knowing who NOT to target is as valuable as knowing who to target. Build an “unqualified” segment — users who match your ICP on paper but never convert. Exclude them from paid campaigns. I have seen this single change reduce ad spend waste by 15-25%.
Start with 3-5 segments. Each segment requires its own messaging, campaigns, and measurement — more segments means more execution overhead. Scale to 6-8 only when your team consistently delivers differentiated experiences for every existing segment. Most successful companies I work with operate with 5-7 active segments.
Market segmentation divides a total addressable market (including people who are not yet customers) into groups for targeting and positioning. Customer segmentation divides your existing customers into groups for retention, expansion, and experience optimization. Market segmentation helps you find customers. Customer segmentation helps you keep and grow them.
Compare conversion rates, revenue per user, and engagement metrics across segments. If segments show statistically different performance on these metrics, they are working. If two segments perform identically, merge them. Run A/B tests within segments to validate that segment-specific campaigns outperform generic ones. A 10-15% lift in conversion rate from segmented campaigns is a good benchmark.
Yes, even with a small customer base. Start with two segments: active customers and at-risk customers (no engagement in 30+ days). Send different messages to each group. This single split often produces measurable results. As your base grows, add segments based on purchase behavior or product usage. GA4 is free and handles segmentation for businesses of any size.
Review segment definitions and performance quarterly. Check segment sizes (are they growing or shrinking?), conversion rates (are they still differentiated?), and whether new behavioral patterns suggest segments you have not defined yet. Dynamic segments in GA4 update automatically, but the criteria behind them need human review to stay relevant.
Honest reviews of analytics tools, SEO tactics that actually work, and growth strategies for bootstrapped SaaS — no fluff, no affiliate bias.