Customer Segmentation Examples — How to Build Segments That Actually Work
Most customer segmentation guides give you a list of 20+ examples with a one-sentence description each. Neat for skimming, useless...
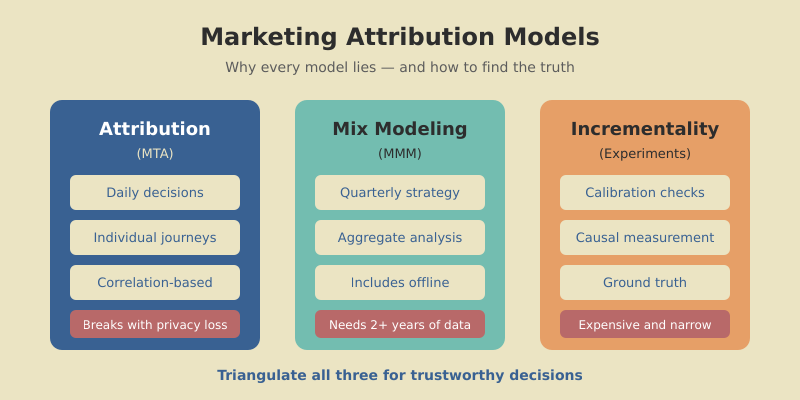
Every marketing team I’ve worked with has the same problem: they’re making budget decisions based on attribution data that’s lying to them. Not because the tools are broken — but because marketing attribution models are,...
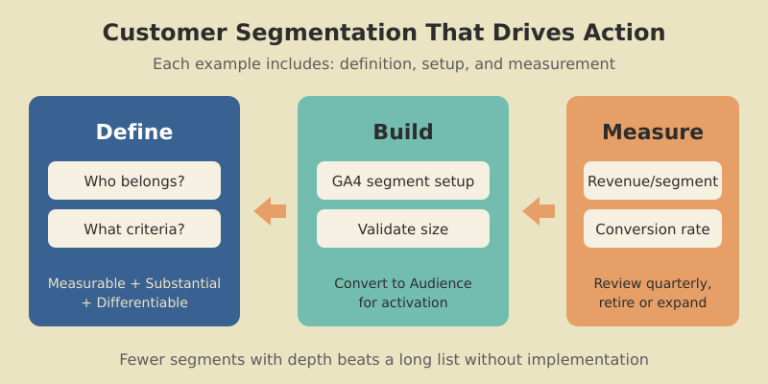
Most customer segmentation guides give you a list of 20+ examples with a one-sentence description each. Neat for skimming, useless...
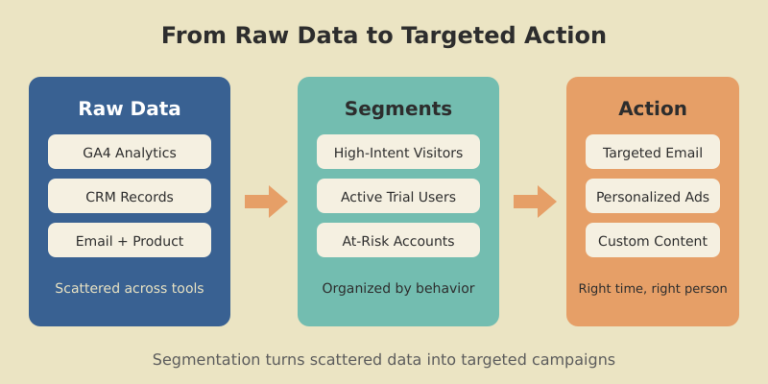
Most marketing teams say they segment their audience. In practice, they split an email list by job title, call it...
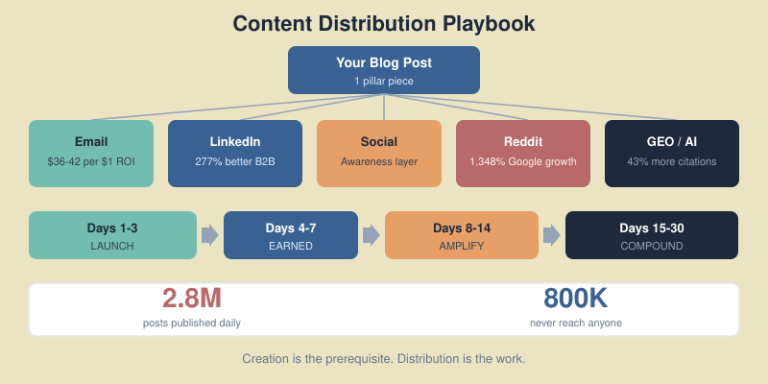
Here’s a stat that should make every content marketer uncomfortable: roughly 2.8 million blog posts go live every single day....
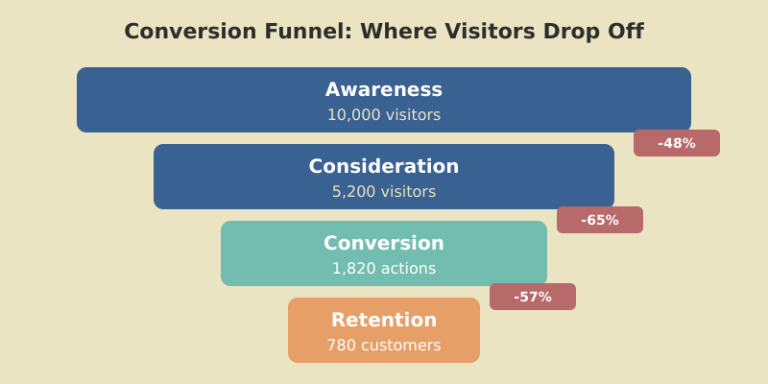
What Funnel Optimization Actually Means (And What Most Guides Miss) So what is conversion funnel optimization? In simple terms, it’s...
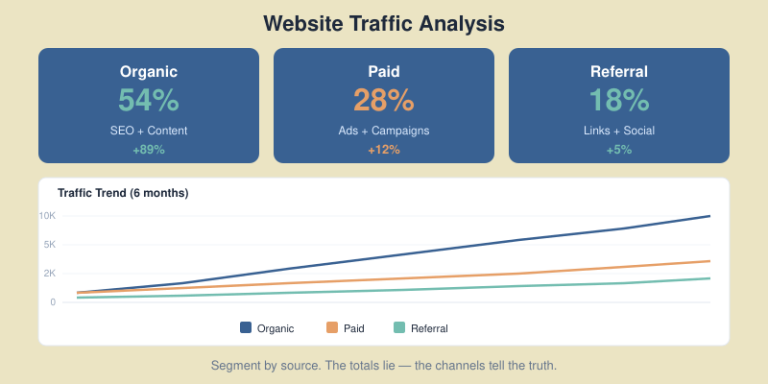
What Web Traffic Analysis Actually Tells You (Beyond Pageviews) Most marketers open their analytics dashboard, glance at pageviews, and move...
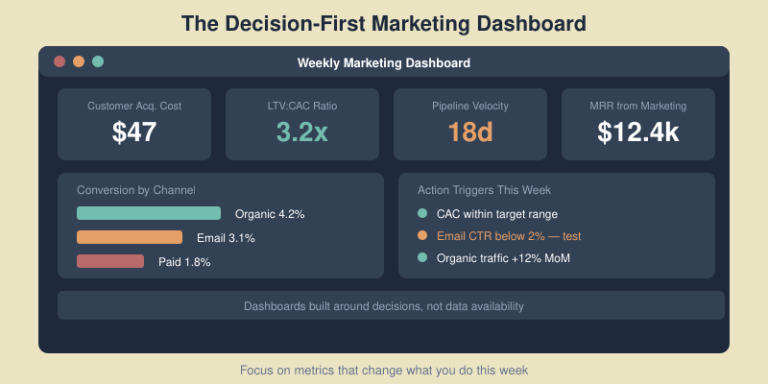
I have built, inherited, and — more often than I care to admit — quietly abandoned more marketing dashboards than...
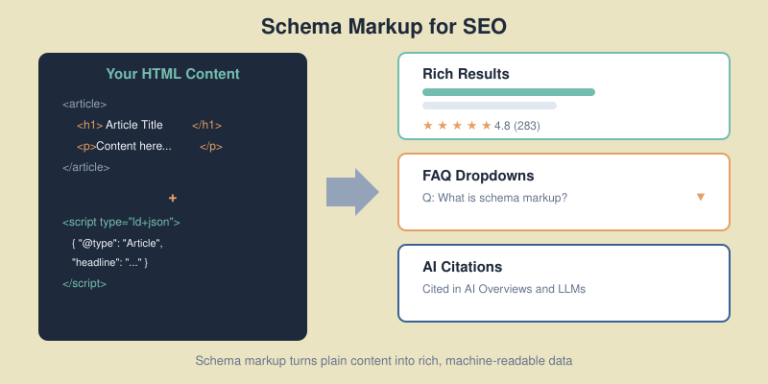
When I first started adding schema markup to client websites back in 2018, most marketers dismissed it as “developer stuff.”...
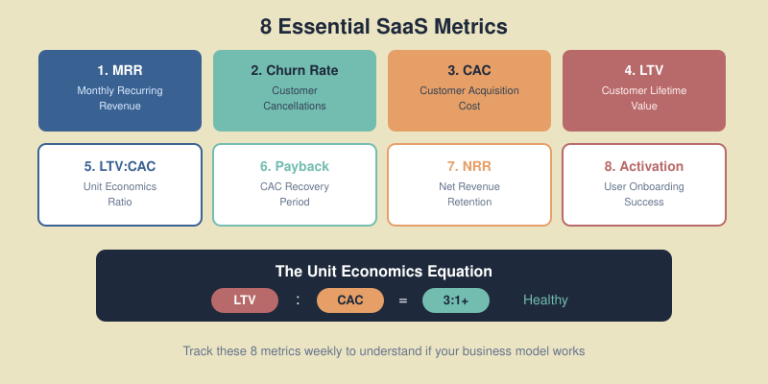
You’ve launched your SaaS product. Users are signing up. Revenue is coming in. But when an investor asks about your...
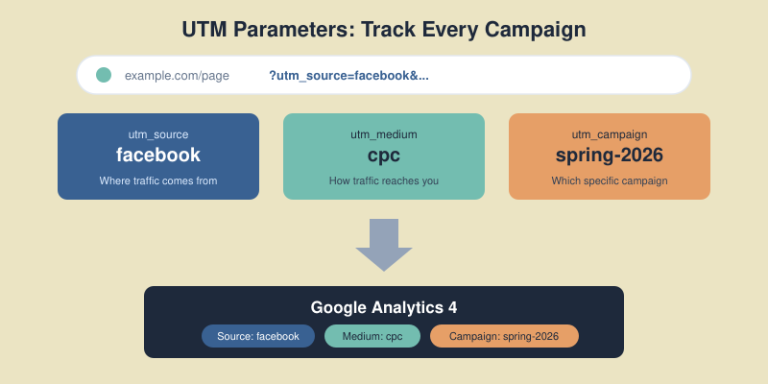
You’re running campaigns across email, social media, paid ads, and partner sites. Traffic is coming in. But when you open...
Honest reviews of analytics tools, SEO tactics that actually work, and growth strategies for bootstrapped SaaS — no fluff, no affiliate bias.